
Provided by KTX Cattleman Capital, in conjunction with Trading Spaces. Commentary for entertainment only. Not financial advice.
The Process · 26-11-12 07:00 CT
Wick or Close: Which Counts? Reading the Price That Settles a Candle
Opinion and commentary from KTX.
Data as of 26-11-12
Wick or close: which counts? The short answer: the close carries the signal.
This is chart-reading practice, not a trading signal, and the charts below are illustrations. They show no tickers and no market levels.
A chart style older than most markets
Candlestick charts are usually traced to Japanese rice trading, and they were introduced to the Western world in 1991, when Steve Nison published Japanese Candlestick Charting Techniques (Wikipedia, “Candlestick chart”, checked 26-11-12). Today they remain a cornerstone of technical analysis. Learning the colors is easy. Knowing which part of the candle to trust takes practice.
Four prices in every candle
Each candle records four prices for its period: the open, the high, the low and the close.
- The body spans the open to the close. An up candle closes above its open; a down candle closes below it.
- The wicks, also called shadows, mark the highest and lowest prices traded during the period.
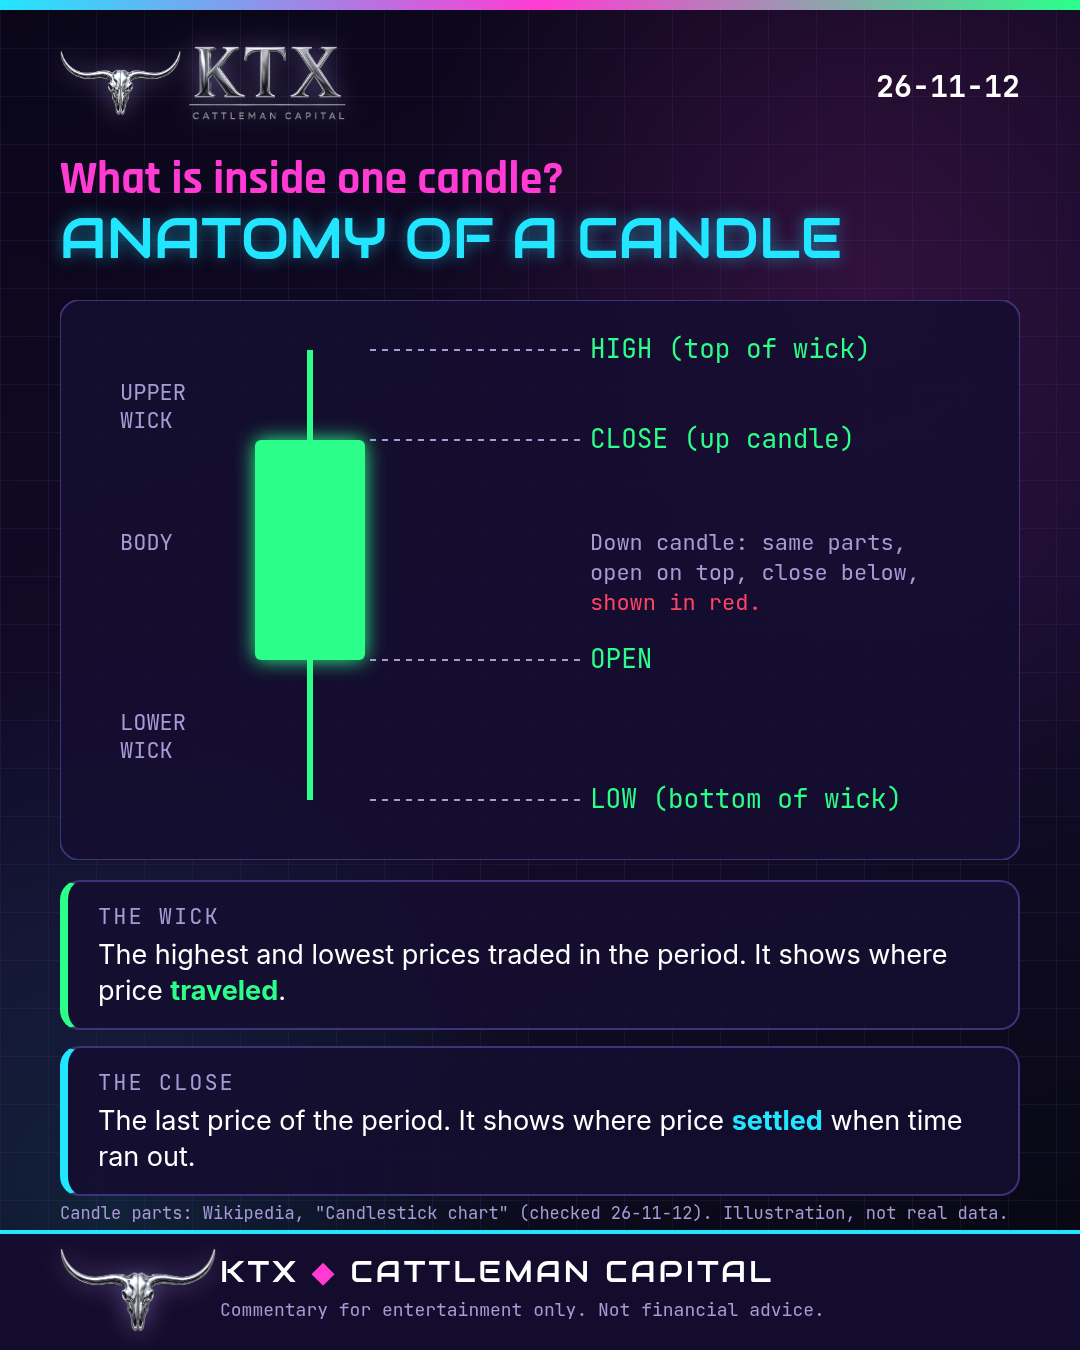
That gives two very different kinds of information. A wick shows where price traveled. The close shows where price settled when time ran out.
The level test: visit or settle?
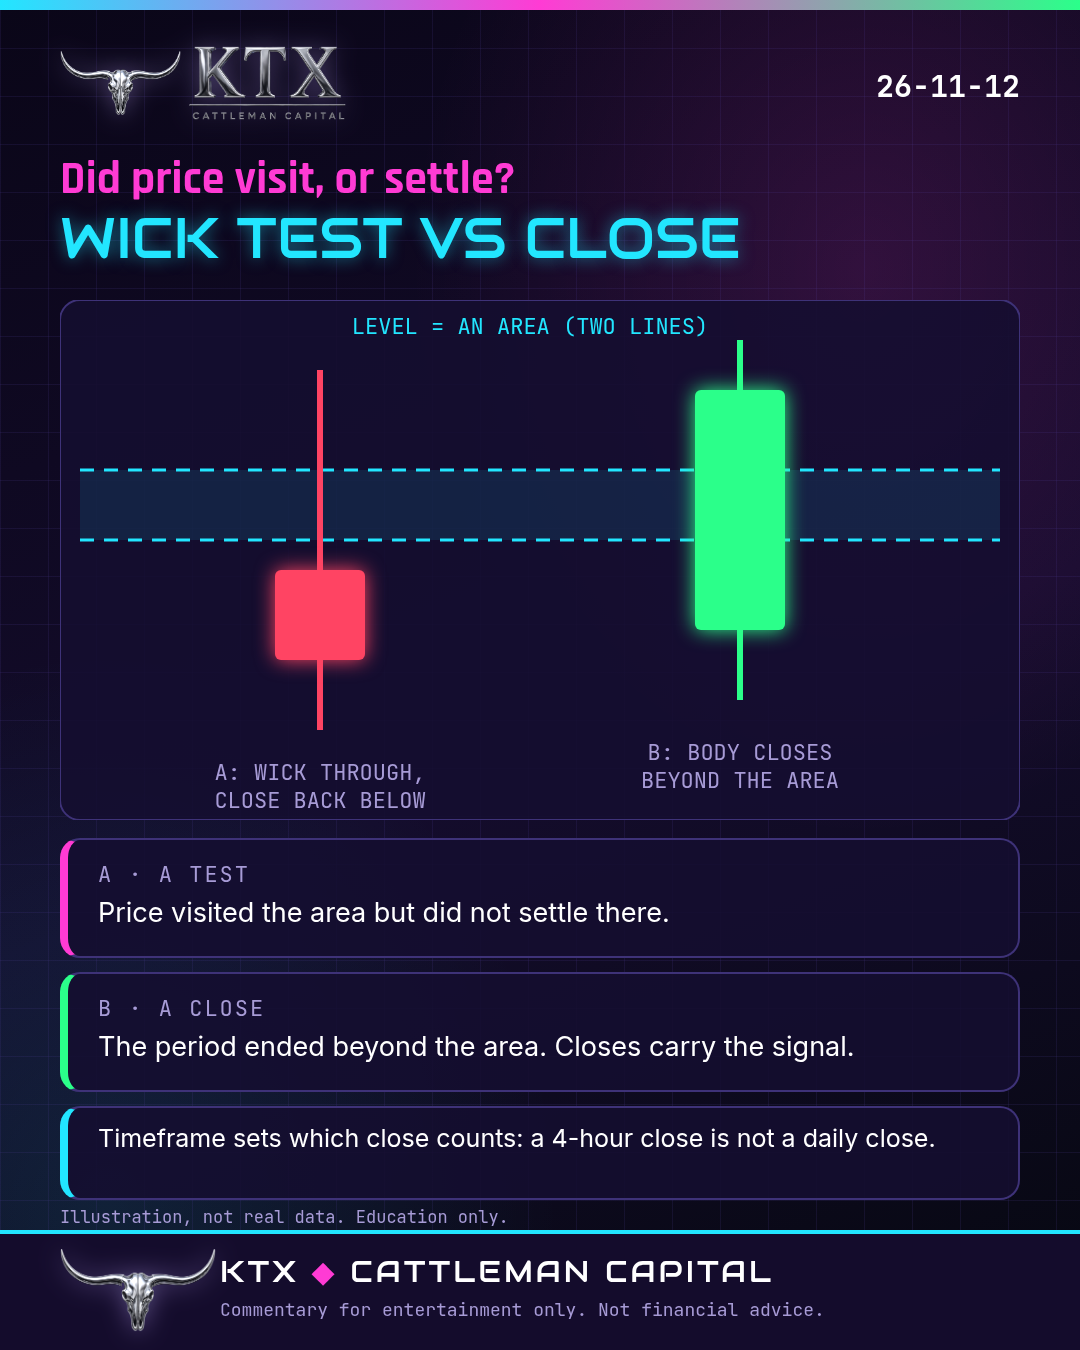
A level is better drawn as an area with two lines than as one exact price, because price often wicks through a single line. Once the area is drawn, every touch falls into one of two cases.
- A wick test. The wick pierces the area, and the body closes back on the original side. Price visited and did not stay.
- A close beyond. The body closes on the far side of the area. That close is the information we treat as the signal. A wick alone is not.
Timeframe decides which close counts
A 4-hour close and a daily close are different verdicts. One long daily wick can contain several separate 4-hour closes. Choose the timeframe you read before you judge a level, then judge it by that timeframe’s close.
Two more patterns worth naming
- Wicks on both sides. Long wicks above and below show buyers and sellers both pushing, with neither holding the move for that period.
- A long wick with a body that holds. A wick reaches into an area while the body closes back away from it. The area pushed price back before the period ended. That is a rejection.
A practice habit
Pick a chart you already follow and one timeframe. Mark one level as an area. Label every touch “wick test” or “close beyond,” and write down what the next few candles did.
Naming every touch as a test or a close is one of the simplest ways to slow down and read a chart honestly.
The public lesson post for this piece is on the KTX channel at Trading Spaces.
Tie Your Horse to a Solid Post.
Sources
On Trading Spaces
Week in Review and deeper dives
Full editions, the Friday Week in Review and longer deep dives publish first on the KTX channel, for Trading Spaces members.
Trading Spaces is a separate community with its own terms and privacy policy.
Provided by KTX Cattleman Capital, in conjunction with Trading Spaces. Commentary for entertainment only. Not financial advice.